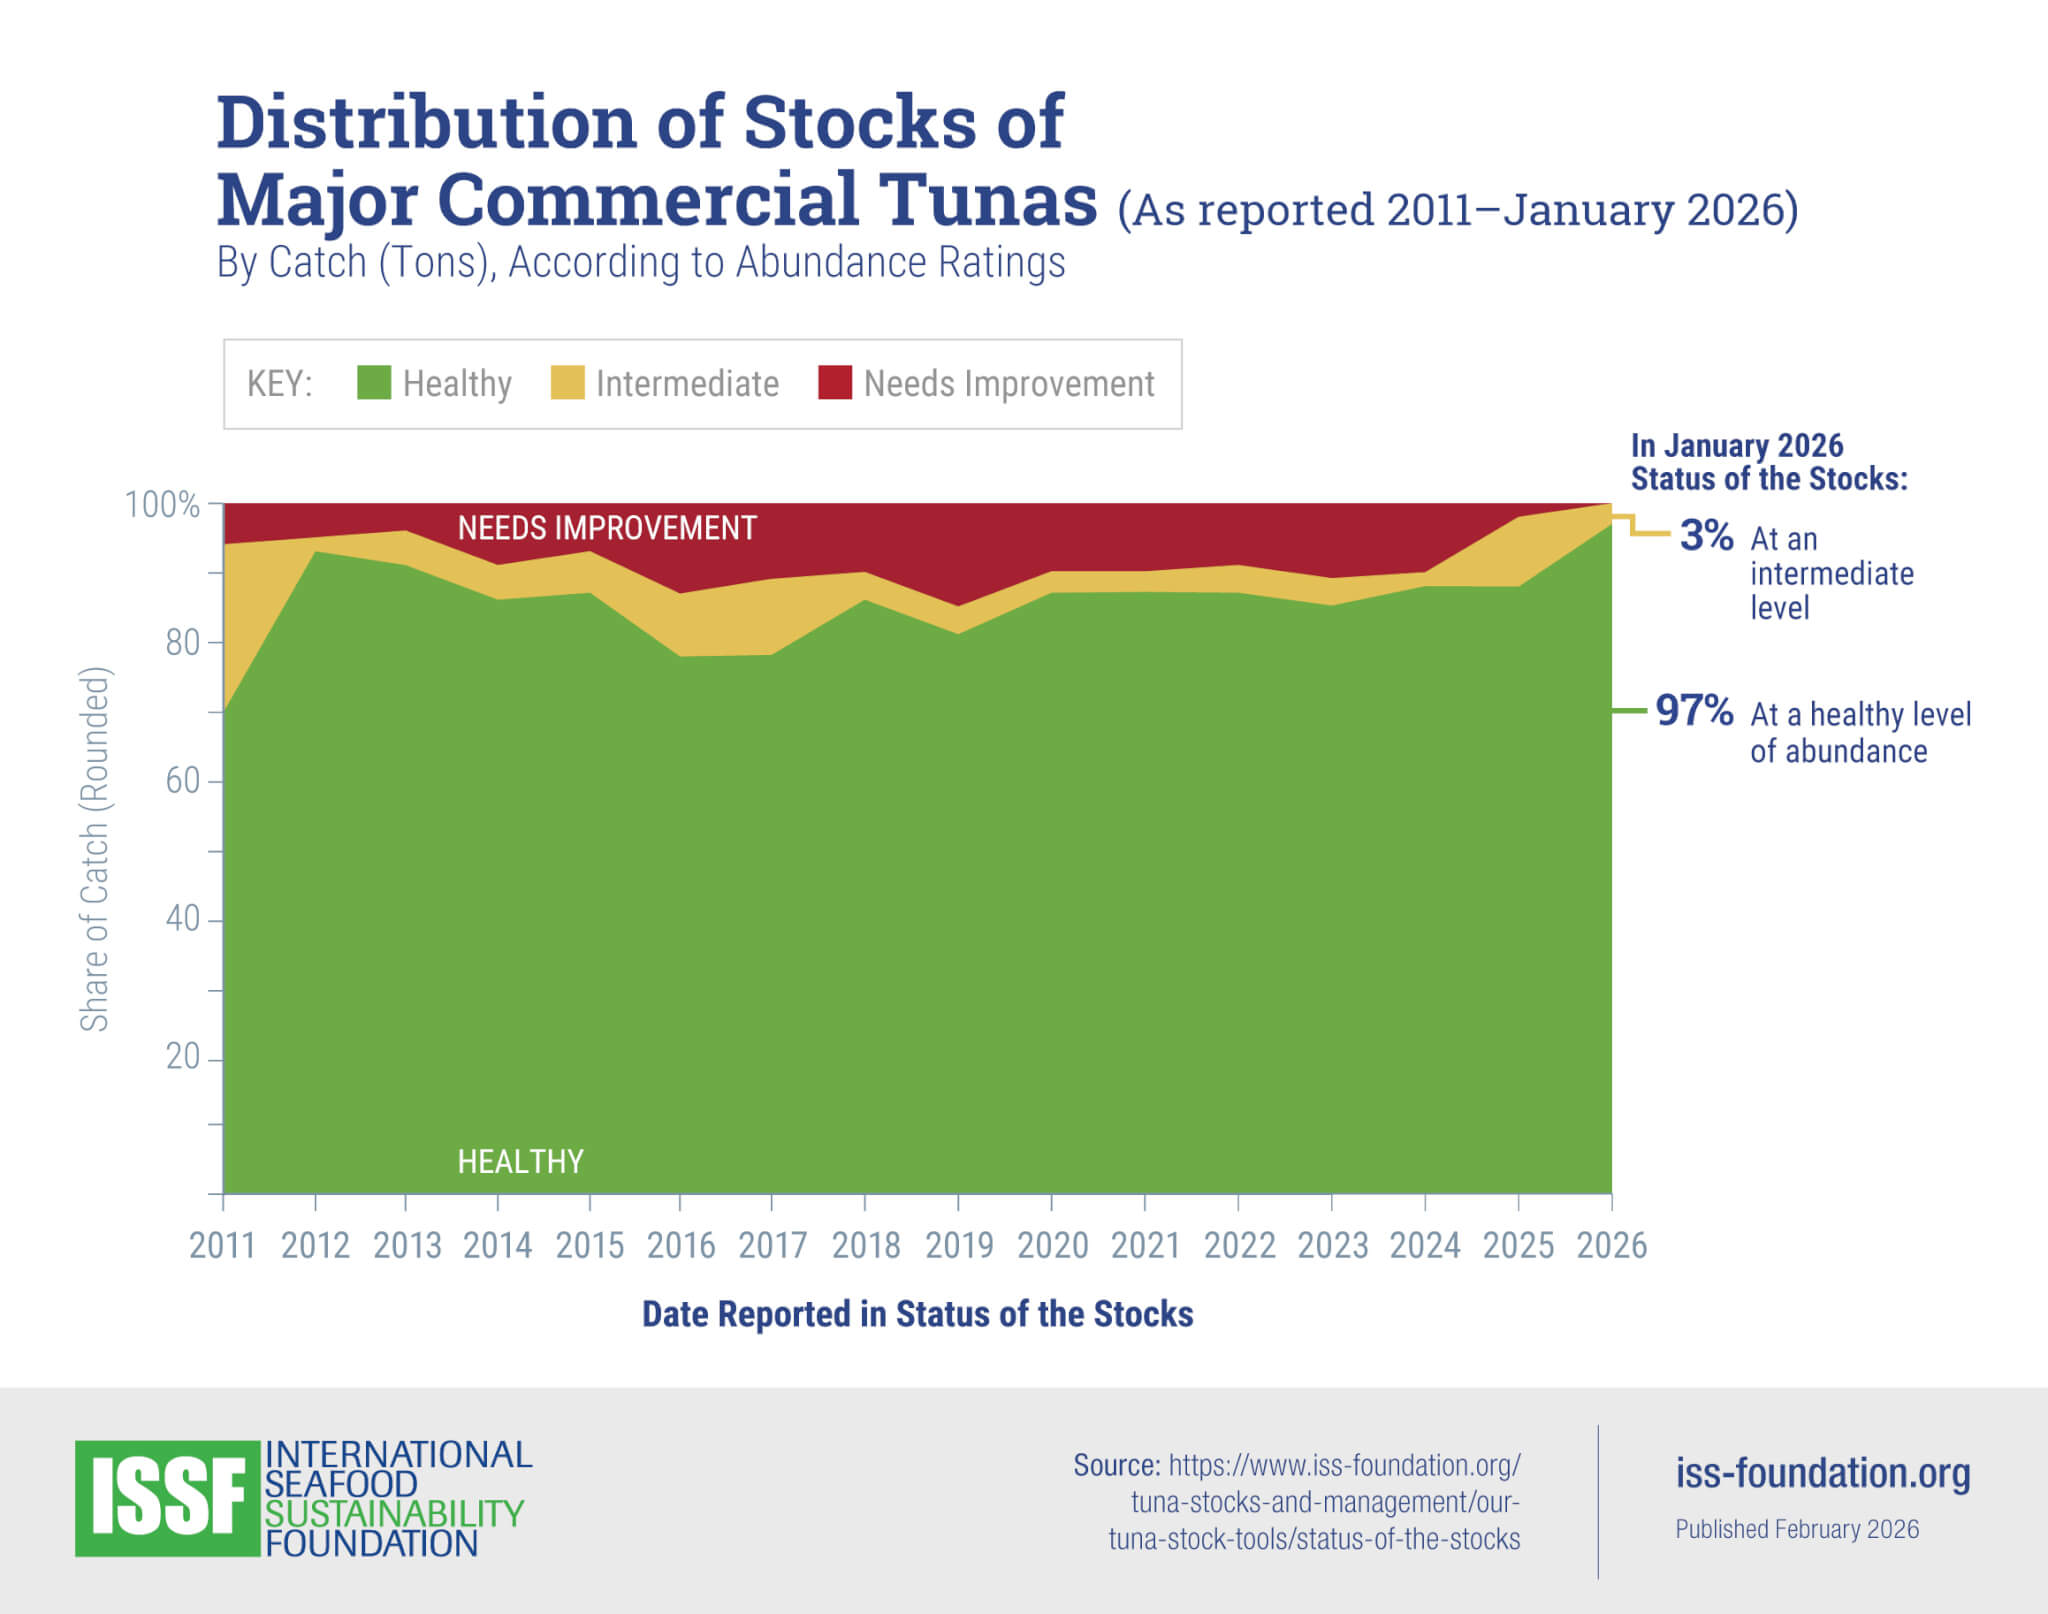
By stock and by catch (in tons), this bar chart indicates commercial tuna abundance and fishing mortality. The green bars show the percentage at a “healthy” level.
This chart uses data from the ISSF 2026-01: Status of the World Fisheries for Tuna. January 2026 report.
Downloads: 106