Our interactive tool allows you to visualize current and historical data from ISSF’s Status of the Stocks report, which compiles scientific assessments of 23 commercial tuna stocks worldwide.
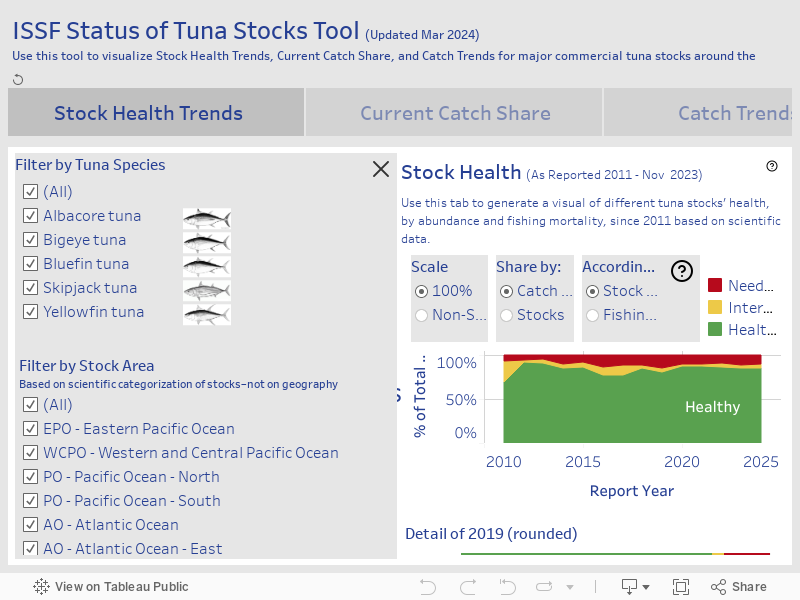
The tool has three tabs — one for visualizing tuna stock health since 2011, another for visualizing the current tuna catch by fishing method, and a third with catch trends by fishing method since 1950.
Read this press release for more background on the launch of this tool in 2018 and the most recent release for details on the Catch Trends tab.
Customized Graphics of Key Tuna Data
You can generate a variety of customized graphics within the tool based on the criteria you choose in the checkboxes (e.g., “tuna species,“ “stock area,” and “gear type”) and buttons. On the Tableau line at the bottom of the tool, use the symbol links at the right to:
- Undo or redo your last action, or reset the dashboard
- Share the graphics you generate via email, Twitter, or Facebook
- Download contents in different file formats (e.g., CSV, Excel, PDF, image files)
- See graphics in full-screen format
This tool uses the same dataset as the Status of the Stocks report. All data is compiled from catch datasets published by the tuna RFMOs. In cases when catch data has recently been presented at the corresponding RFMO Scientific Committee meeting but has not been uploaded to the RFMO website yet, catch datasets have been provided directly to ISSF by RFMO staff.
Tuna Data Visualization Tool
List of Tuna Stocks by Stock Areas
The table below shows which stock areas you should select in the tool to see data on certain tuna stocks or species. For example:
- Selecting only “AO – Atlantic Ocean” in the tool will show data for the tuna stock(s) that have a single whole Atlantic stock.
- Selecting one individual Atlantic area, such as “AO – Atlantic Ocean – East,” in the tool will show data for the tuna stock(s) that have a specific “Eastern Atlantic” stock within the Atlantic Ocean.
- Selecting all Atlantic areas together will show data for all tuna stock(s) in the Atlantic Ocean.
Note that the first Status of the Stocks report (reporting 2011 data) did not include bluefin tuna stocks.
| STOCK | Species | Stock Area | RFMO Management |
|---|---|---|---|
| EPO-BET | Bigeye tuna | Eastern Pacific Ocean | IATTC |
| EPO-YFT | Yellowfin tuna | Eastern Pacific Ocean | IATTC |
| EPO-SKJ | Skipjack tuna | Eastern Pacific Ocean | IATTC |
| WPO-BET | Bigeye tuna | Western and Central Pacific Ocean | WCPFC |
| WPO-YFT | Yellowfin tuna | Western and Central Pacific Ocean | WCPFC |
| WPO-SKJ | Skipjack tuna | Western and Central Pacific Ocean | WCPFC |
| PO-ALB-N | Albacore tuna | Pacific Ocean – North | IATTC WCPFC |
| PO-ALB-S | Albacore tuna | Pacific Ocean – South | IATTC WCPFC |
| PO-PBF | Bluefin tuna | Pacific Ocean – North | IATTC WCPFC |
| AO-BET | Bigeye tuna | Atlantic Ocean | ICCAT |
| AO-YFT | Yellowfin tuna | Atlantic Ocean | ICCAT |
| AO-SKJ-E | Skipjack tuna | Atlantic Ocean – East | ICCAT |
| AO-SKJ-W | Skipjack tuna | Atlantic Ocean – West | ICCAT |
| AO-ALB-N | Albacore tuna | Atlantic Ocean – North | ICCAT |
| AO-ALB-S | Albacore tuna | Atlantic Ocean – South | ICCAT |
| AO-ALB-M | Albacore tuna | Atlantic Ocean – Mediterranean sea | ICCAT |
| AO-BFT-E | Bluefin tuna | Atlantic Ocean – East | ICCAT |
| AO-BFT-W | Bluefin tuna | Atlantic Ocean – West | ICCAT |
| IO-BET | Bigeye tuna | Indian Ocean | IOTC |
| IO-YFT | Yellowfin tuna | Indian Ocean | IOTC |
| IO-SKJ | Skipjack tuna | Indian Ocean | IOTC |
| IO-ALB | Albacore tuna | Indian Ocean | IOTC |
| SH-SBT | Bluefin tuna | Southern Hemisphere | CCSBT |