The International Seafood Sustainability Foundation (ISSF) has expanded its “Stock Status Tool” to include an additional category of critical data — tuna catch trends since 1950 by purse seine, pole-and-line, longline, gillnet, and other gear types.
“Credible transparency and accountability across global tuna fisheries is made possible through gathering, disseminating, analyzing, and activating data that is both science-based and attainable,” said ISSF President Susan Jackson. “As a science-first organization, we are committed to making ISSF’s technical content — especially legacy publications like the Status of the Stocks report — and the research supporting it increasingly accessible and available in user-friendly formats. We are pleased to announce the expansion of this essential tool.”
Explore a new dataset in our stock-status tool: tuna catch trends since 1950 by gear type. Share on XThe tool debuted in 2018 with two data-tracking and visualization capabilities: tuna-stock health status since 2011, and current catch share across stocks. It is publicly accessible and does not require additional applications to use.
Located on ISSF’s Website and built using Tableau technology, the “Interactive Stock Status and Catch Tool” is based on ISSF’s semi-annual “Status of the Stocks” report, which compiles data from the science bodies at tuna Regional Fisheries Management Organizations (RFMOs).
The new “Catch Trends” dataset and tab in the tool allow users to:
- Filter gear-type catch data by tuna species, stock area, and year range
- See data as actual catch values in tonnes or scaled to 100%
- Download graphics as images, PDFs, PowerPoint slides, or Tableau workbooks
- Download the raw dataset (CSV format) or the dataset of user-customized graphics (Excel or CSV format)
- Share graphics through email, Twitter, or Facebook via embed code or custom URLs
Sample Use Cases of the Tool
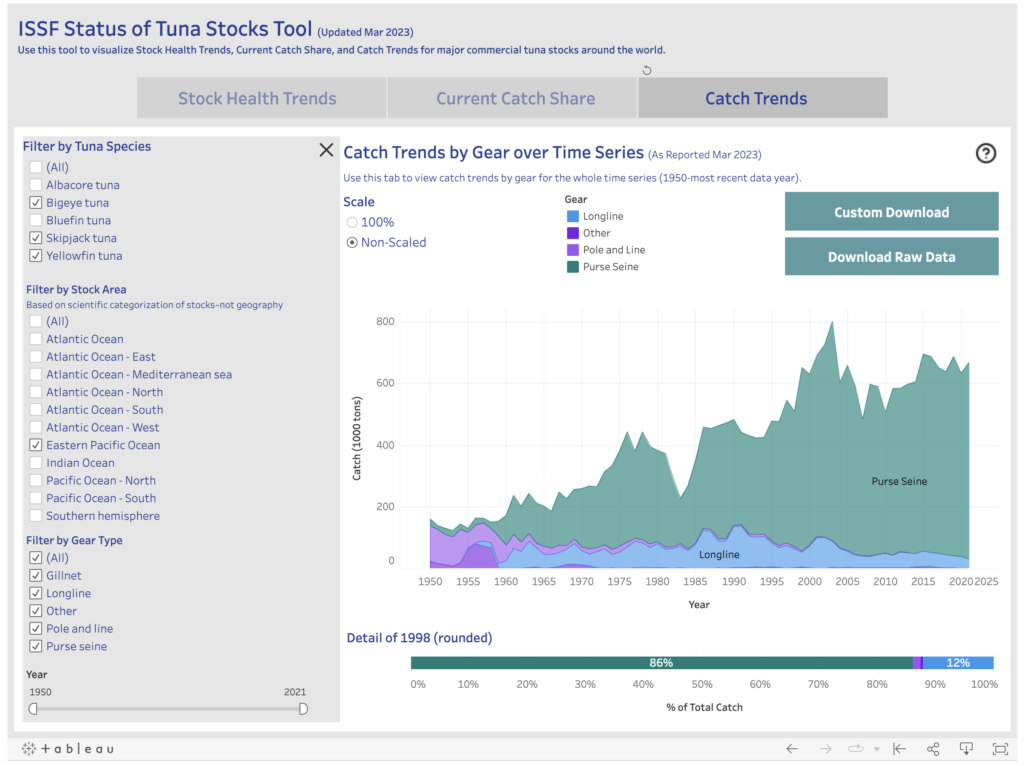
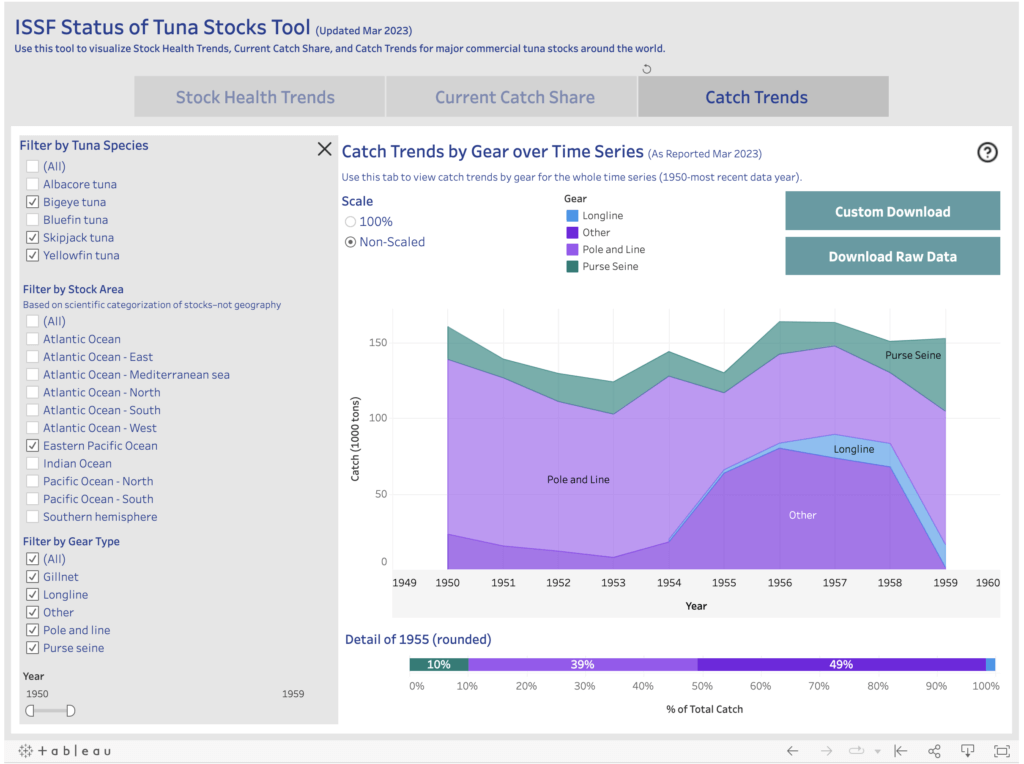
For example, stakeholders interested in analyzing how catch trends by gear type of tropical tuna in the Eastern Pacific Ocean have changed over time, could first select the three tropical tuna species (bigeye, skipjack, yellowfin) and then select Eastern Pacific Ocean as the Stock Area. These data settings provide users with an overview of how catches changed throughout the whole time series (Figure 1).
Switching the graph type to “Scaled to 100%” (Figure 2) will help users better visualize the share of catch by gear type in the earlier years, when catches were lower.
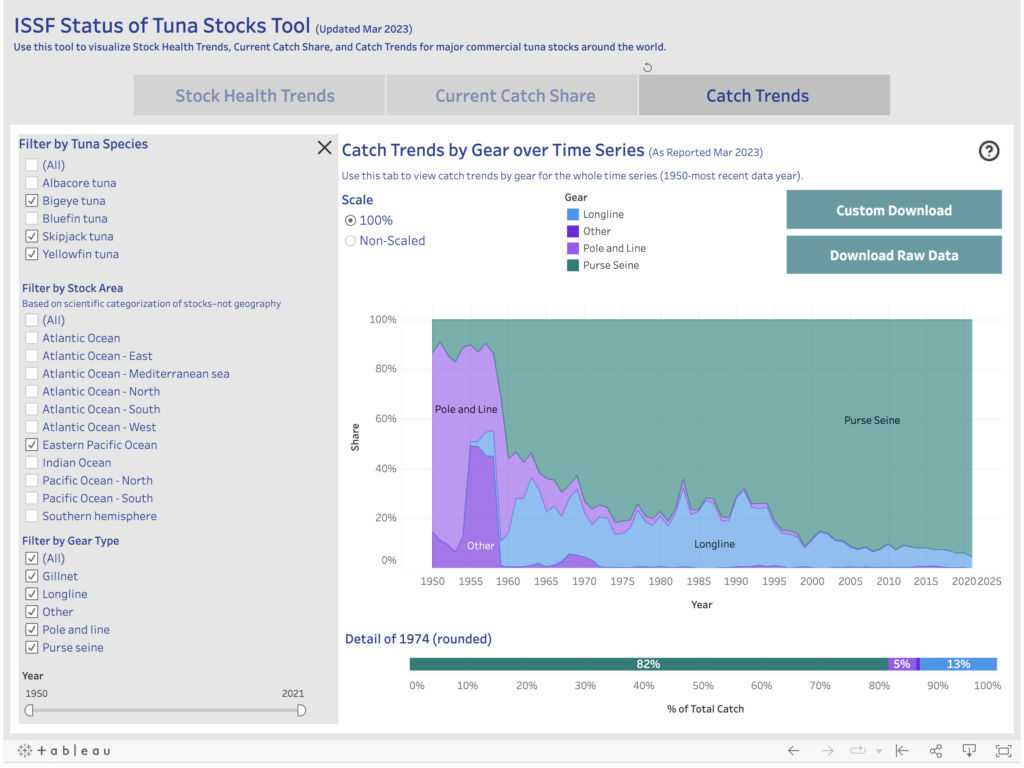
Displaying the data in this way makes it more evident that pole-and-line catches accounted for a high percentage of catches in the 1950s and also that in recent years the highest percentage of the catch has come from purse-seine fisheries.
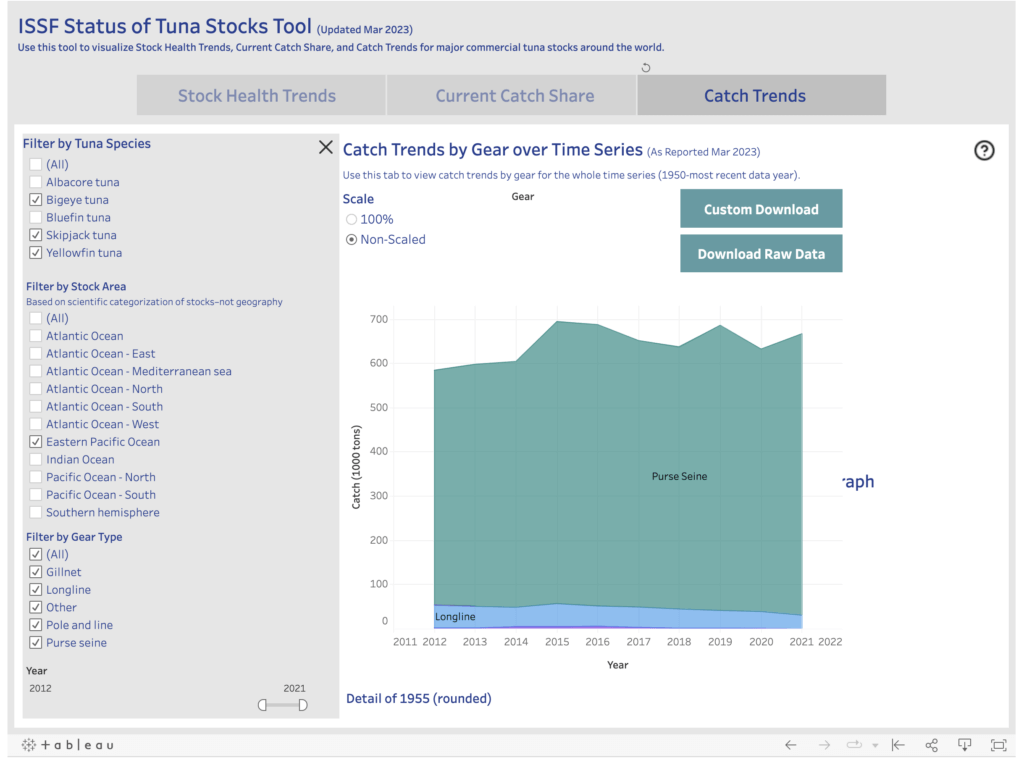
Users interested in looking at a specific period in more detail can adjust the tool’s “Year” slider to show only the range they are interested in. Following the example above, they could zoom in to 1950-1959 and display data as actual values (i.e. non-scaled) (Figure 3). Doing the same for the last 10 years of the series (2011-2021) paints a clear picture of how catch has changed in terms of total catch (from ~150K tonnes annually to around 650K tonnes) and in terms of share of catch by gear type (from a variety of gears to purse seine being predominant) (Figure 4).
Similarly, stakeholders studying the impact of RFMO stock management decisions can consult the tool to see how catches have increased or decreased during certain time frames — or how catches are trending during stock rebuilding periods.
About the Status of the Stocks Report
There are 23 stocks of major commercial tuna species worldwide — 6 albacore, 4 bigeye, 4 bluefin, 5 skipjack, and 4 yellowfin stocks. The Status of the Stocks summarizes the results of the most recent scientific assessments of these stocks, as well as the current management measures adopted by the RFMOs. Status of the Stocks assigns color ratings (green, yellow or orange) using a consistent methodology based on three factors: Abundance, Exploitation/Management (fishing mortality), and Environmental Impact (bycatch).
ISSF produces several Status of the Stocks reports each year to provide clarity about where we stand — and how much more needs to be done — to ensure the long-term sustainability of tuna stocks. The Status of the Stocks presents a comprehensive analysis of tuna stocks by species, and the Evaluation of the Sustainability of Global Tuna Stocks Relative to Marine Stewardship Council (MSC) Criteria provides scores for the stocks and RFMOs based on MSC assessment criteria. Together, these tools help to define the continuous improvement achieved, as well as the areas and issues that require more attention.