Of the total commercial tuna catch worldwide, 86.4% is sourced from stocks at “healthy” levels of abundance, according to the newest International Seafood Sustainability Foundation (ISSF) Status of the Stocks report. In addition, 9.2% of the total tuna catch came from overfished stocks, and 4.4% came from stocks at an intermediate level of abundance.
Which #tuna stocks worldwide are considered overfished and/or subject to overfishing? Find out in our latest Status of the Stocks report. Share on XThe increase in the overall percentage of the catch coming from stocks at healthy levels of abundance — from 80.5% in the March 2022 report up to 86.4% in the July 2022 update — is mainly attributed to a positive change in the rating of the Eastern Pacific Ocean (EPO) skipjack stock, which represents about 6% of the global tuna catch. In March 2022, the rating for the status of the EPO skipjack stock had been changed from green to yellow due to the lack of a recent stock assessment by the relevant regional fisheries management organization (RFMO), the Inter-American Tropical Tuna Commission (IATTC). Given the new assessment carried out by the IATTC in May 2022, the rating is being restored to green for the July 2022 report.
Several tuna stocks are considered overfished and/or subject to overfishing:
- Indian Ocean yellowfin, Pacific bluefin and Mediterranean albacore stocks are overfished and subject to overfishing.
- Indian Ocean albacore and bigeye stocks are subject to overfishing.
In terms of management, the main update since the March 2022 report is the inclusion of the new Management Procedure adopted by the Indian Ocean Tuna Commission (IOTC) for Indian Ocean bigeye tuna.
ISSF publishes its signature Status of the Stocks report multiple times each year using the most current scientific data on 23 major commercial tuna stocks.
Key Statistics in the Report
- Abundance or “spawning biomass” levels: Globally, 65% of the 23 stocks are at healthy levels of abundance (up from 61% in March), 22% are at an intermediate level, and 13% are overfished.
- Fishing mortality levels: 74% of the 23 stocks are experiencing a well-managed fishing mortality rate, and 22% are experiencing overfishing.
- Total catch: The catch of major commercial tuna stocks was 4.9 million tonnes in 2020, about 10% lower than in 2019. 57% was skipjack tuna, followed by yellowfin (30%), bigeye (8%), and albacore (4%). Bluefin tuna accounted for 1% of the global catch.
- Largest tuna catches by stock: The five largest catches in tonnes, unchanged since the previous report, are Western Pacific Ocean skipjack, Western Pacific Ocean yellowfin, Indian Ocean skipjack, Indian Ocean yellowfin, and Eastern Pacific Ocean skipjack.
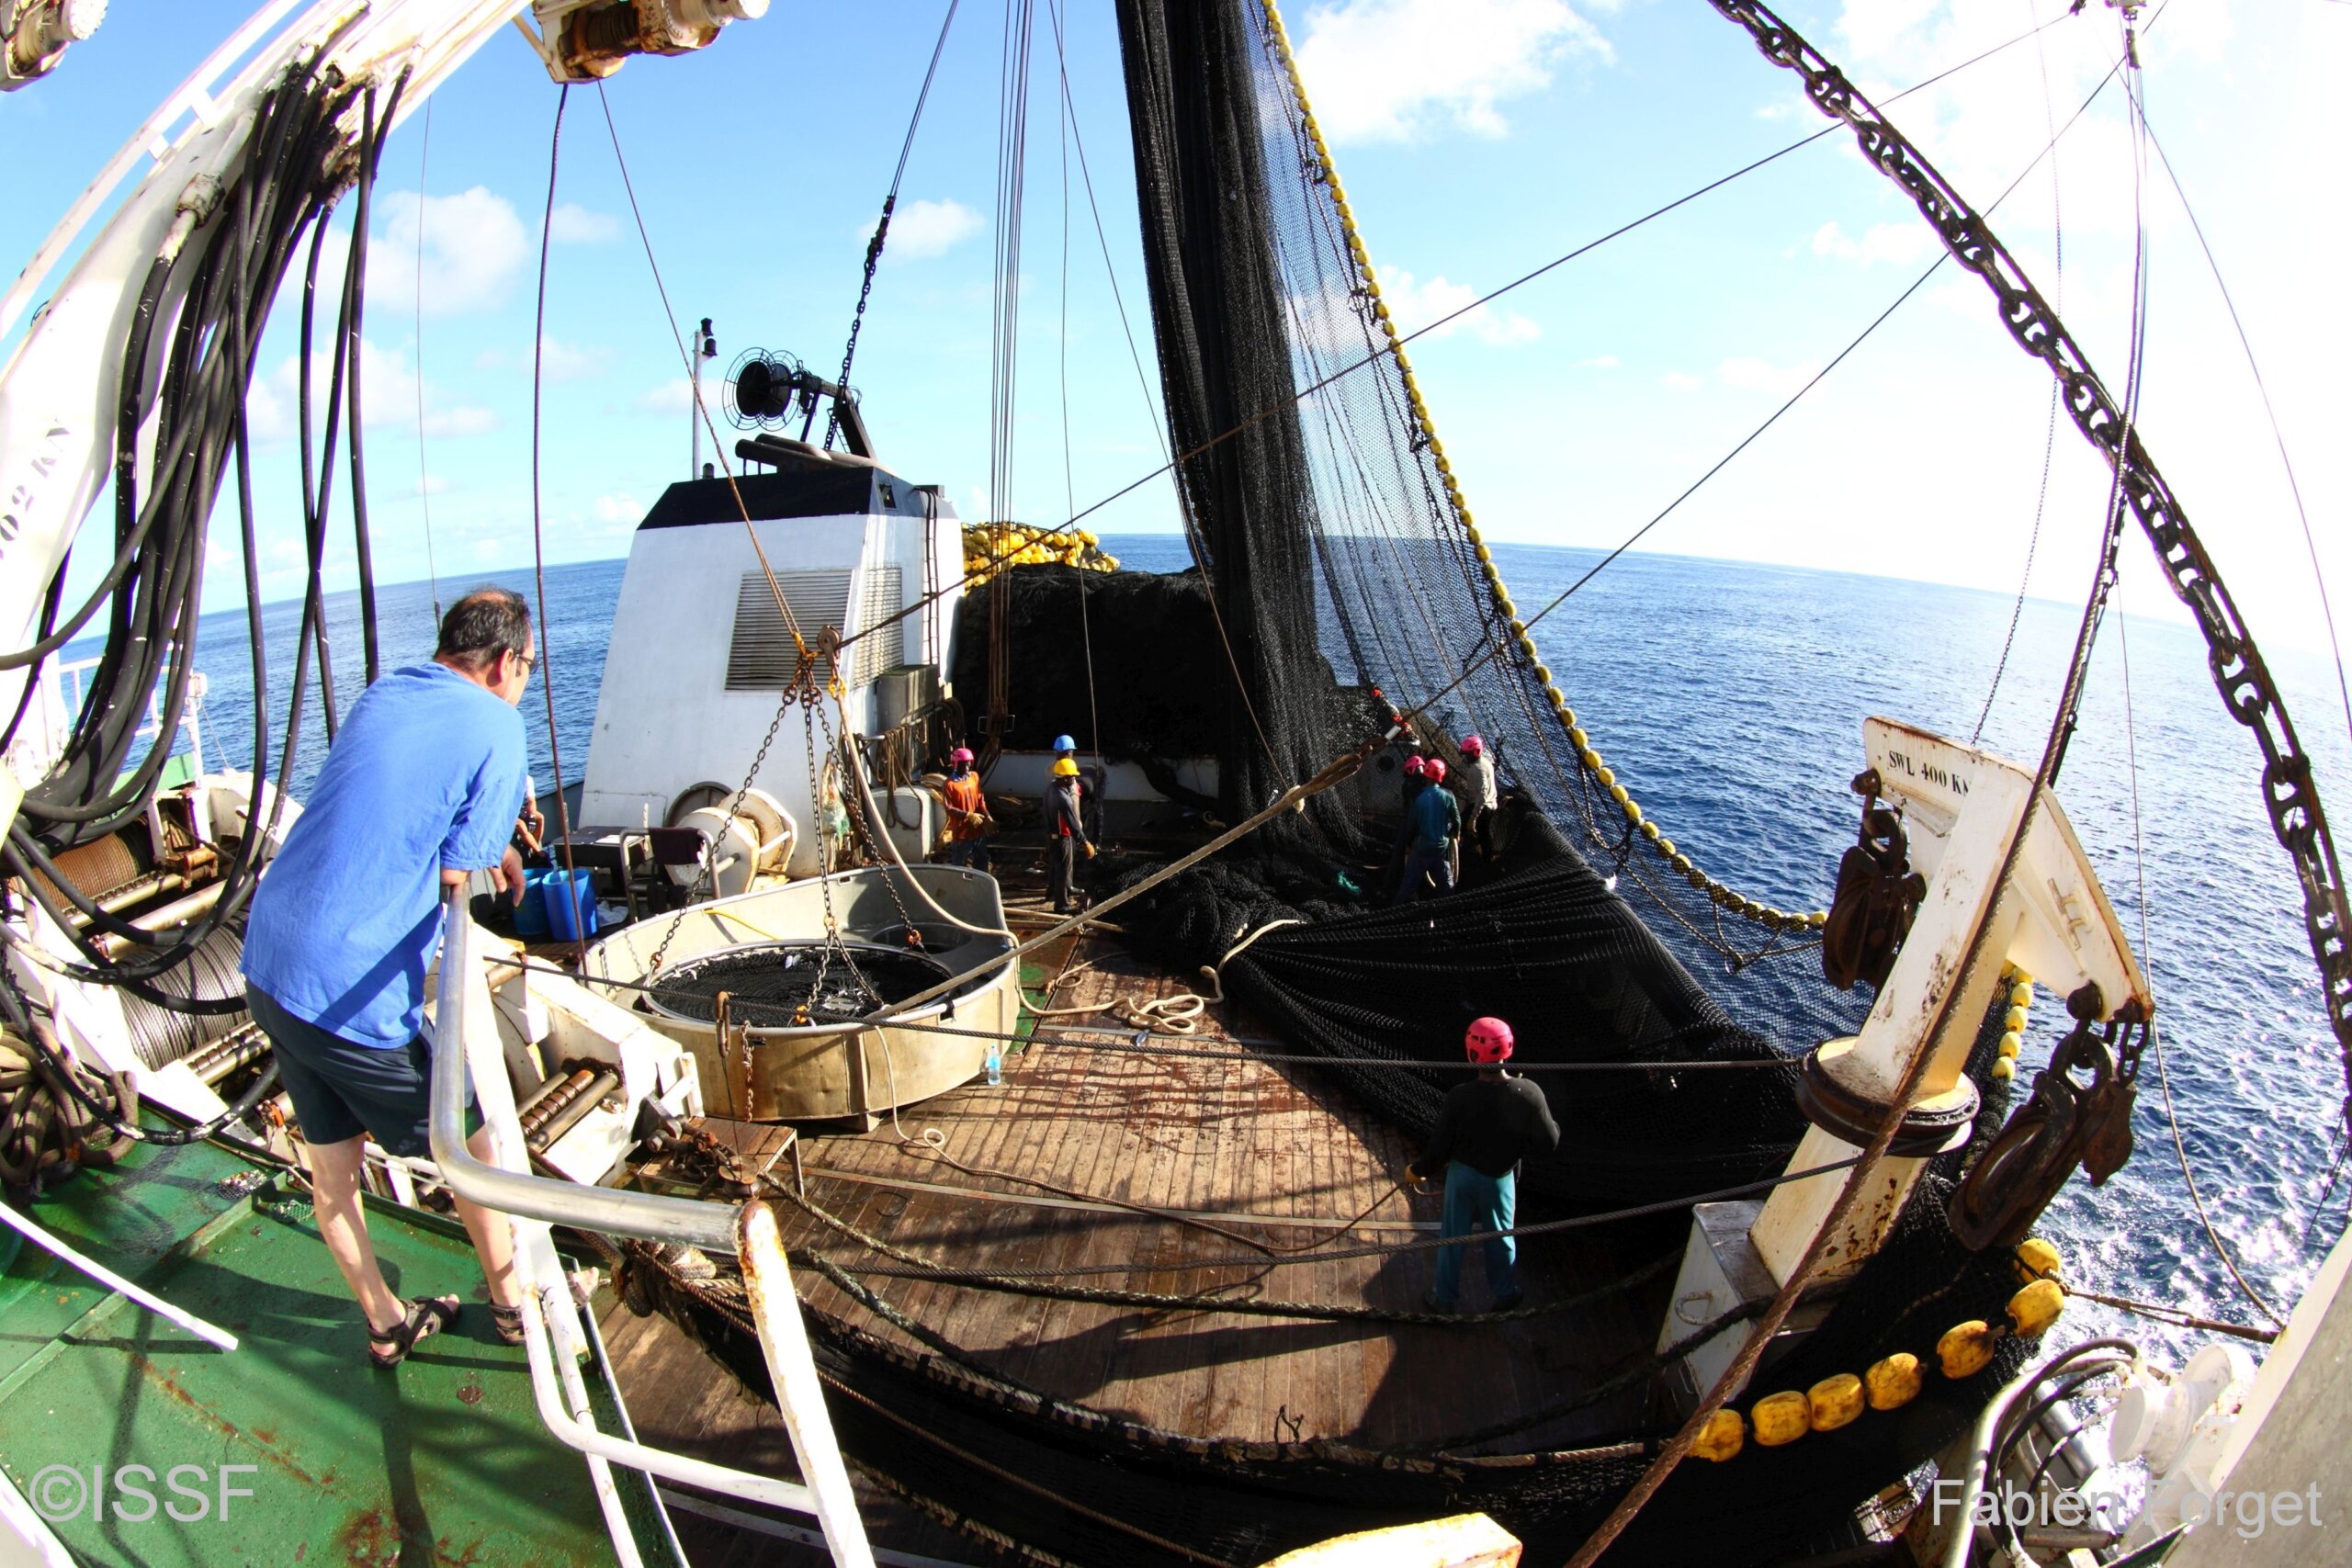
- Tuna production by fishing gear: 66% of the catch is made by purse seining, followed by longline (10%), pole-and-line (7%), gillnets (4%), and miscellaneous gears (13%). These percentages have not changed since the previous report.
The Status of the Stocks report is reviewed by the ISSF Scientific Advisory Committee, which provides advice on its content. The report does not advocate any particular seafood purchase decisions.
The Pandemic’s Impact on the Status of the Stocks
The July 2022 Status of the Stocks is the fifth update of the report since March 2020, when the COVID-19 pandemic began to impact the work of the RFMOs. Some RFMOs have issued exemptions to certain monitoring requirements such as observer coverage. As such, the report’s summaries of management measures for the stocks, particularly in relation to observer coverage, may not be completely accurate in reflecting the monitoring that is ongoing during this exceptional period.
The report includes updated catch data and the latest changes to stock status and management as of early July 2022.
About the Report
There are 23 stocks of major commercial tuna species worldwide — 6 albacore, 4 bigeye, 4 bluefin, 5 skipjack, and 4 yellowfin stocks. The Status of the Stocks summarizes the results of the most recent scientific assessments of these stocks, as well as the current management measures adopted by the RFMOs. Status of the Stocks assigns color ratings (green, yellow or orange) using a consistent methodology based on three factors: Abundance, Exploitation/Management (fishing mortality), and Environmental Impact (bycatch).
ISSF produces several Status of the Stocks reports each year to provide clarity about where we stand — and how much more needs to be done — to ensure the long-term sustainability of tuna stocks. The Status of the Stocks presents a comprehensive analysis of tuna stocks by species, and the Evaluation of the Sustainability of Global Tuna Stocks Relative to Marine Stewardship Council (MSC) Criteria provides scores for the stocks and RFMOs based on MSC assessment criteria. The MSC-certified fisheries list (Appendix 2) in Status of the Stocks complements the Evaluation report. Together, these tools help to define the continuous improvement achieved, as well as the areas and issues that require more attention.
In addition, ISSF maintains a data-visualization tool based on its Status of the Stocks report. The “Interactive Stock Status Tool” is located on the ISSF website and accessible through the Status of the Stocks overview page; users can easily toggle through tuna abundance and exploitation health indicators by catch or stock and filter by location and species as well as be informed about the share of total catch by species/stocks and gear types.